
 Championship
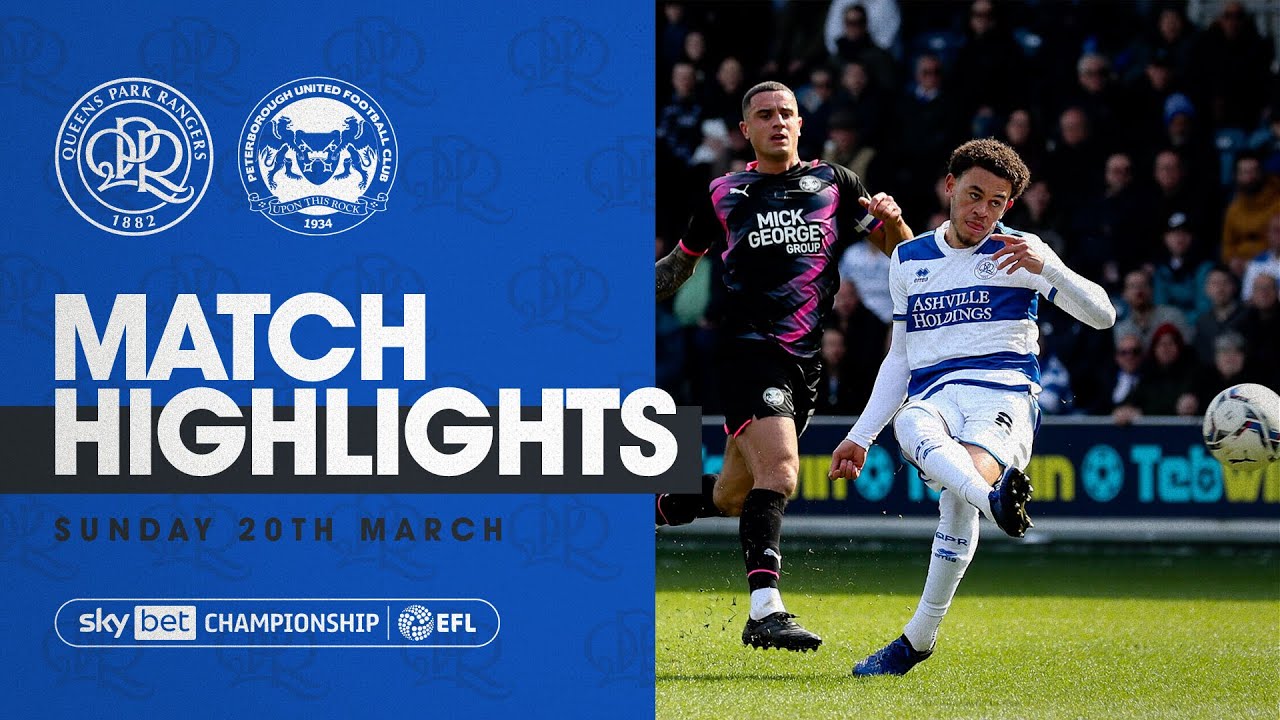
- HT
-
10'
L. Amos
-
66'
S. Field
- HT
-
40'
J. Clarke-Harris
-
45'
B. Mumba
-
53'
J. Clarke-Harris
-
54'
J. Marriott
-
56'
J. Marriott
-
67'
O. Norburn
Queens Park Rangers vs Peterborough United Live score
Events
-
10'10'
L. Amos
A. Gray
-
40'40'
J. Clarke-Harris
-
45'45'
B. Mumba
-
46'46'

H. Burrows
B. Mumba
-
53'53'
J. Clarke-Harris (Penalty)
-
54'54'
J. Marriott
H. Burrows
-
56'56'
J. Marriott
-
57'57'
Jeff Hendrick
Andre Dozzell
-
57'57'
Charlie Austin
Luke Amos
-
58'58'
G. Thomas
A. Gray
-
66'66'
S. Field
-
67'67'
O. Norburn
-
71'71'
J. Fuchs
J. Taylor
-
76'76'
K. Poku
J. Marriott
-
90'+2'90'+2'
J. Taylor
J. Clarke-Harris
Queens Park Rangers vs Peterborough United Lineups
 Queens Park Rangers
Peterborough United

Goalkeeper

 Republic of Ireland
Defender

 England
Midfielder

 Ghana
Ghana


Attacker

 Belgium
Substitutes

 Wales
Wales
Bench


 France

Goalkeeper

Defender


Midfielder


Attacker

Substitutes

 Cameroon
Bench


Top Players
See how Queens Park Rangers and Peterborough United measure up against each other by comparing their top rated lineups! Get all the information you need in this helpful chart.
7.6
7.2
7.0
8.4
7.4
7.4


Queens Park Rangers vs Peterborough United Goal Scorer
| Queens Park Rangers | Luke Amos (10') |
|---|---|
| Peterborough United | Jonson Clarke-Harris (53')Jonson Clarke-Harris (40')Jack Marriott (54') |
Player Statistics
| Player | Team | Goals | Assists | Tackles | Acc. passes | Duals Won | Minutes played | Position | Rating |
|---|---|---|---|---|---|---|---|---|---|
| Jonson Clarke-Harris |
|
2 | 0 | 0 | 15/23 (65%) | 10/22 | 90 | A | |
| Luke Amos |
|
1 | 0 | 1 | 11/17 (64%) | 5/6 | 57 | A | |
| Joe Ward |
|
0 | 0 | 3 | 15/28 (53%) | 6/8 | 90 | M | |
| Jack Marriott |
|
1 | 0 | 0 | 2/4 (50%) | 2/6 | 76 | A | |
| Kwame Poku |
|
0 | 0 | 3 | 4/5 (80%) | 4/7 | 14 | M | |
| Robert Dickie |
|
0 | 0 | 1 | 52/63 (82%) | 10/13 | 90 | D | |
| Ronnie Edwards |
|
0 | 0 | 2 | 20/27 (74%) | 4/6 | 90 | D | |
| George Thomas |
|
0 | 0 | 1 | 12/14 (85%) | 2/4 | 32 | M | |
| Jeff Hendrick |
|
0 | 0 | 0 | 9/15 (60%) | 2/4 | 33 | M | |
| Sam McCallum |
|
0 | 0 | 2 | 31/45 (68%) | 6/9 | 90 | M | |
| Sammie Szmodics |
|
0 | 0 | 2 | 23/29 (79%) | 2/8 | 90 | A | |
| Oliver Norburn |
|
0 | 0 | 2 | 35/40 (87%) | 4/10 | 90 | M | |
| Charlie Austin |
|
0 | 0 | 0 | 3/5 (60%) | 2/3 | 33 | A | |
| Ilias Chair |
|
0 | 0 | 0 | 46/51 (90%) | 2/10 | 90 | A | |
| Jack Taylor |
|
0 | 0 | 2 | 10/19 (52%) | 2/3 | 71 | M | |
| Harrison Burrows |
|
0 | 1 | 2 | 11/13 (84%) | 2/5 | 44 | M | |
| Josh Knight |
|
0 | 0 | 2 | 35/48 (72%) | 2/6 | 90 | D | |
| Frankie Kent |
|
0 | 0 | 1 | 21/36 (58%) | 2/4 | 90 | D | |
| Bali Mumba |
|
0 | 0 | 3 | 9/14 (64%) | 7/12 | 46 | M | |
| Samuel Field |
|
0 | 0 | 3 | 45/62 (72%) | 6/8 | 90 | M | |
| Andre Gray |
|
0 | 1 | 0 | 7/10 (70%) | 1/5 | 58 | A | |
| Jeando Fuchs |
|
0 | 0 | 2 | 7/8 (87%) | 3/7 | 19 | M | |
| Andre Dozzell |
|
0 | 0 | 0 | 19/25 (76%) | 1/2 | 57 | M | |
| Albert Adomah |
|
0 | 0 | 5 | 12/24 (50%) | 7/17 | 90 | M | |
| Jimmy Dunne |
|
0 | 0 | 2 | 42/63 (66%) | 9/14 | 90 | D | |
| Dion Sanderson |
|
0 | 0 | 2 | 33/47 (70%) | 3/11 | 90 | D |
Shots
| Player | Team | Shots on target | Shots off target | Shots blocked | Dribble attempts (succ.) | Position | Rating |
|---|---|---|---|---|---|---|---|
| Jonson Clarke-Harris |
|
4/4 | 0 | 0 | 0/0 | A | |
| Luke Amos |
|
1/1 | 0 | 0 | 1/1 | A | |
| Joe Ward |
|
0/0 | 0 | 0 | 1/1 | M | |
| Jack Marriott |
|
2/2 | 0 | 0 | 0/0 | A | |
| Kwame Poku |
|
0/0 | 0 | 0 | 0/1 | M | |
| Robert Dickie |
|
0/0 | 0 | 0 | 1/1 | D | |
| Ronnie Edwards |
|
0/0 | 0 | 1 | 0/0 | D | |
| George Thomas |
|
0/0 | 0 | 0 | 1/1 | M | |
| Jeff Hendrick |
|
0/0 | 0 | 1 | 0/0 | M | |
| Sam McCallum |
|
0/0 | 0 | 0 | 0/0 | M | |
| Sammie Szmodics |
|
2/2 | 0 | 0 | 0/2 | A | |
| Oliver Norburn |
|
0/0 | 0 | 0 | 1/2 | M | |
| Charlie Austin |
|
0/0 | 0 | 0 | 1/1 | A | |
| Ilias Chair |
|
0/0 | 0 | 0 | 1/6 | A | |
| Jack Taylor |
|
0/0 | 0 | 1 | 0/0 | M | |
| Harrison Burrows |
|
0/0 | 0 | 0 | 0/0 | M | |
| Josh Knight |
|
0/0 | 0 | 1 | 0/0 | D | |
| Frankie Kent |
|
0/0 | 0 | 0 | 0/0 | D | |
| Bali Mumba |
|
0/0 | 0 | 0 | 1/2 | M | |
| Samuel Field |
|
0/0 | 0 | 0 | 0/0 | M | |
| Andre Gray |
|
0/0 | 0 | 0 | 0/1 | A | |
| Jeando Fuchs |
|
0/0 | 0 | 0 | 0/0 | M | |
| Andre Dozzell |
|
0/0 | 0 | 0 | 0/0 | M | |
| Albert Adomah |
|
0/0 | 0 | 0 | 2/5 | M | |
| Jimmy Dunne |
|
0/0 | 0 | 0 | 0/0 | D | |
| Dion Sanderson |
|
0/0 | 0 | 1 | 1/2 | D |
Goalkeeper Statistics
| Player | Team | Saves | punches | Inside box saves | Rating |
|---|---|---|---|---|---|
| David Cornell |
|
0 | 0 | 0 | |
| Keiren Westwood |
|
5 | 0 | 3 |
Queens Park Rangers Form
16 Mar 2022
Nottingham Forest
 Queens Park Rangers
3 - 1
Queens Park Rangers
13 Mar 2022
Luton Town
 Queens Park Rangers
1 - 2
Queens Park Rangers
23 Feb 2022
Queens Park Rangers
 Blackpool
2 - 1
Blackpool
Peterborough United Form
16 Mar 2022
Peterborough United
 Swansea City
2 - 3
Swansea City
12 Mar 2022
Peterborough United
 Stoke City
2 - 2
Stoke City
08 Mar 2022
AFC Bournemouth
 Peterborough United
1 - 1
Peterborough United
04 Mar 2022
Huddersfield Town
 Peterborough United
3 - 0
Peterborough United
01 Mar 2022
Peterborough United
 Man City
0 - 2
Man City
Stats
Possession
0
Penalties
1
9
Fouls
12
3
Substitutes
4
5
Saves
0
Shots
11
Total shots
11
1
Shots on goal
6
10
Off target
5
7
Shots inside box
8
6
Shots outside box
4
122
Attacks
93
61
Dangerous attacks
21
Passes
467
Total passes
323
336
Accurate passes
223
17
Tackles
24
4
Corners
2
Discipline
1
Yellow cards
3
Championship Standings
| # | Team | PTS | MP | GD |
|---|---|---|---|---|
| 1 |  Leicester City Leicester City |
97 | 46 | 48 |
| 2 |  Ipswich Town Ipswich Town |
96 | 46 | 35 |
| 3 |  Leeds United Leeds United |
90 | 46 | 38 |
| 4 |  Southampton Southampton |
87 | 46 | 24 |
| 5 |  West Bromwich Albion West Bromwich Albion |
75 | 46 | 23 |
| 6 |  Norwich City Norwich City |
73 | 46 | 15 |
| 7 |  Hull City Hull City |
70 | 46 | 8 |
| 8 |  Middlesbrough Middlesbrough |
69 | 46 | 9 |
| 9 |  Coventry City Coventry City |
64 | 46 | 11 |
| 10 |  Preston North End Preston North End |
63 | 46 | -11 |
| 11 |  Bristol City Bristol City |
62 | 46 | 2 |
| 12 |  Cardiff City Cardiff City |
62 | 46 | -17 |
| 13 |  Millwall Millwall |
59 | 46 | -10 |
| 14 | Swansea City |
57 | 46 | -6 |
| 15 |  Watford Watford |
56 | 46 | 0 |
| 16 |  Sunderland Sunderland |
56 | 46 | -2 |
| 17 | Stoke City |
56 | 46 | -11 |
| 18 | Queens Park Rangers |
56 | 46 | -11 |
| 19 |  Blackburn Rovers Blackburn Rovers |
53 | 46 | -14 |
| 20 |  Sheffield Wednesday Sheffield Wednesday |
53 | 46 | -24 |
| 21 |  Plymouth Argyle Plymouth Argyle |
51 | 46 | -11 |
| 22 |  Birmingham City Birmingham City |
50 | 46 | -15 |
| 23 | Huddersfield Town |
45 | 46 | -29 |
| 24 |  Rotherham United Rotherham United |
27 | 46 | -52 |
Promotion
Promotion Play-off
Relegation
Match info
Referee D. Webb
City London
Stadium Kiyan Prince Foundation Stadium
Address South Africa Road, Shepherd's Bush
Capacity 18000
