
 Championship
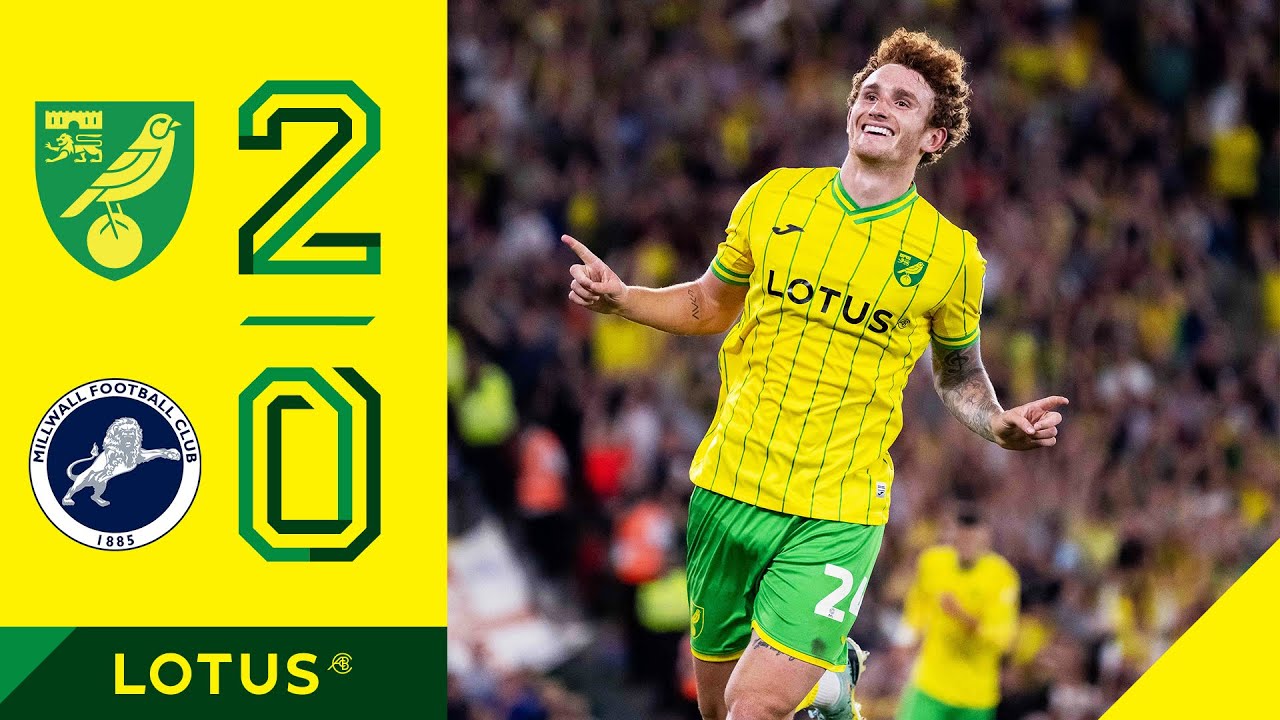
- HT
-
50'
J. Sargent
-
75'
J. Sargent
-
84'
L. Gibbs
-
90'
T. Krul
- HT
-
19'
G. Saville
-
66'
G. Honeyman
Norwich City vs Millwall Live score
Events
-
19'19'
G. Saville
-
50'50'
J. Sargent
-
66'66'
G. Honeyman
-
70'70'

A. Voglsammer
T. Burey
-
70'70'
Z. Flemming
G. Honeyman
-
70'70'
J. Shackleton
B. Mitchell
-
75'75'
J. Sargent
-
78'78'
T. Cantwell
K. Dowell
-
79'79'
A. Ramsey
O. Hernandez
-
84'84'
L. Gibbs
-
86'86'
J. Cooper
D. McNamara
-
86'86'
T. Pukki
J. Sargent
-
90'+2'90'+2'
T. Krul
Norwich City vs Millwall Lineups
 Norwich City
Millwall

Goalkeeper

 Netherlands
Defender

 Scotland
 England
 Republic of Ireland
Midfielder


 Chile
ChileAttacker

 Germany
 Luxembourg
 USA
USASubstitutes


 Finland
Bench


 Brazil
 Kosovo
Goalkeeper

 Poland
Defender

Midfielder


 Northern Ireland
Attacker


 Congo DR
Substitutes


Bench


 Wales
WalesTop Players
See how Norwich City and Millwall measure up against each other by comparing their top rated lineups! Get all the information you need in this helpful chart.
8.1
7.9
7.6
7.1
6.9
6.8


Norwich City vs Millwall Goal Scorer
| Norwich City | Josh Sargent (75')Josh Sargent (50') |
|---|
Player Statistics
| Player | Team | Goals | Assists | Tackles | Acc. passes | Duals Won | Minutes played | Position | Rating |
|---|---|---|---|---|---|---|---|---|---|
| Josh Sargent |
|
2 | 0 | 1 | 15/18 (83%) | 7/17 | 86 | A | |
| Danel Sinani |
|
0 | 1 | 2 | 36/45 (80%) | 4/7 | 90 | A | |
| Andrew Omobamidele |
|
0 | 0 | 2 | 43/56 (76%) | 9/11 | 90 | D | |
| Kieran Dowell |
|
0 | 1 | 1 | 37/43 (86%) | 6/9 | 78 | M | |
| Marcelino Núñez |
|
0 | 0 | 1 | 48/54 (88%) | 5/11 | 90 | M | |
| Liam Gibbs |
|
0 | 0 | 4 | 36/44 (81%) | 5/8 | 90 | M | |
| Shaun Hutchinson |
|
0 | 0 | 2 | 17/30 (56%) | 7/10 | 90 | D | |
| Max Aarons |
|
0 | 0 | 2 | 36/49 (73%) | 5/8 | 90 | D | |
| Kenny McLean |
|
0 | 0 | 0 | 58/68 (85%) | 4/6 | 90 | D | |
| Grant Hanley |
|
0 | 0 | 1 | 33/37 (89%) | 7/10 | 90 | D | |
| Danny McNamara |
|
0 | 0 | 3 | 13/18 (72%) | 6/7 | 86 | M | |
| George Honeyman |
|
0 | 0 | 2 | 11/12 (91%) | 2/6 | 70 | A | |
| Jamie Shackleton |
|
0 | 0 | 1 | 5/5 (100%) | 1/1 | 20 | M | |
| Ryan Leonard |
|
0 | 0 | 3 | 19/26 (73%) | 4/9 | 90 | D | |
| Aaron Ramsey |
|
0 | 0 | 0 | 4/5 (80%) | 0/0 | 12 | M | |
| Murray Wallace |
|
0 | 0 | 1 | 25/39 (64%) | 5/9 | 90 | D | |
| George Saville |
|
0 | 0 | 2 | 19/28 (67%) | 9/24 | 90 | M | |
| Andreas Voglsammer |
|
0 | 0 | 0 | 3/6 (50%) | 0/1 | 20 | A | |
| Zian Flemming |
|
0 | 0 | 0 | 7/10 (70%) | 1/1 | 20 | M | |
| Benik Afobe |
|
0 | 0 | 3 | 15/18 (83%) | 6/13 | 90 | A | |
| Onel Hernández |
|
0 | 0 | 2 | 19/20 (95%) | 3/13 | 78 | A | |
| Teemu Pukki |
|
0 | 0 | 0 | 3/3 (100%) | 0/0 | 4 | A | |
| Tyler Burey |
|
0 | 0 | 0 | 7/9 (77%) | 3/11 | 70 | A | |
| Todd Cantwell |
|
0 | 0 | 0 | 6/8 (75%) | 0/2 | 12 | M | |
| Scott Malone |
|
0 | 0 | 0 | 14/22 (63%) | 0/3 | 90 | M | |
| Jake Cooper |
|
0 | 0 | 0 | 2/3 (66%) | 0/0 | 4 | D | |
| Billy Mitchell |
|
0 | 0 | 0 | 21/25 (84%) | 2/4 | 70 | M |
Shots
| Player | Team | Shots on target | Shots off target | Shots blocked | Dribble attempts (succ.) | Position | Rating |
|---|---|---|---|---|---|---|---|
| Josh Sargent |
|
3/3 | 0 | 0 | 1/3 | A | |
| Danel Sinani |
|
0/0 | 0 | 0 | 2/2 | A | |
| Andrew Omobamidele |
|
0/0 | 0 | 1 | 1/1 | D | |
| Kieran Dowell |
|
0/0 | 0 | 0 | 0/0 | M | |
| Marcelino Núñez |
|
0/0 | 0 | 0 | 1/1 | M | |
| Liam Gibbs |
|
0/0 | 0 | 0 | 0/0 | M | |
| Shaun Hutchinson |
|
0/0 | 0 | 3 | 0/0 | D | |
| Max Aarons |
|
0/0 | 0 | 1 | 0/0 | D | |
| Kenny McLean |
|
0/0 | 0 | 0 | 0/1 | D | |
| Grant Hanley |
|
0/0 | 0 | 0 | 0/1 | D | |
| Danny McNamara |
|
0/0 | 0 | 1 | 1/1 | M | |
| George Honeyman |
|
0/0 | 0 | 0 | 0/0 | A | |
| Jamie Shackleton |
|
0/0 | 0 | 0 | 0/0 | M | |
| Ryan Leonard |
|
0/0 | 0 | 1 | 0/1 | D | |
| Aaron Ramsey |
|
0/0 | 0 | 0 | 0/0 | M | |
| Murray Wallace |
|
0/0 | 0 | 2 | 0/1 | D | |
| George Saville |
|
1/1 | 0 | 1 | 0/0 | M | |
| Andreas Voglsammer |
|
1/1 | 0 | 0 | 0/0 | A | |
| Zian Flemming |
|
0/0 | 0 | 0 | 0/0 | M | |
| Benik Afobe |
|
0/0 | 1 | 0 | 0/1 | A | |
| Onel Hernández |
|
0/0 | 0 | 0 | 0/3 | A | |
| Teemu Pukki |
|
0/0 | 0 | 0 | 0/0 | A | |
| Tyler Burey |
|
0/0 | 1 | 0 | 1/5 | A | |
| Todd Cantwell |
|
0/0 | 0 | 0 | 0/2 | M | |
| Scott Malone |
|
0/0 | 0 | 0 | 0/0 | M | |
| Jake Cooper |
|
0/0 | 0 | 0 | 0/0 | D | |
| Billy Mitchell |
|
0/0 | 0 | 0 | 1/2 | M |
Goalkeeper Statistics
| Player | Team | Saves | punches | Inside box saves | Rating |
|---|---|---|---|---|---|
| Tim Krul |
|
2 | 0 | 1 | |
| Bartosz Białkowski |
|
1 | 0 | 1 |
Norwich City Form
16 Aug 2022
Norwich City
 Huddersfield Town
2 - 1
Huddersfield Town
09 Aug 2022
Norwich City
 Birmingham City
2 - 2
Birmingham City
06 Aug 2022
Norwich City
 Wigan Athletic
1 - 1
Wigan Athletic
30 Jul 2022
Cardiff City
 Norwich City
1 - 0
Norwich City
Millwall Form
16 Aug 2022
Swansea City
 Millwall
2 - 2
Millwall
06 Aug 2022
Sheffield United
 Millwall
2 - 0
Millwall
02 Aug 2022
Cambridge United
 Millwall
1 - 0
Millwall
30 Jul 2022
Millwall
 Stoke City
2 - 0
Stoke City
Stats
Possession
4
Fouls
16
3
Substitutes
4
2
Saves
1
0
Offsides
2
Shots
19
Total shots
11
2
Shots on goal
2
17
Off target
9
9
Shots inside box
10
10
Shots outside box
2
109
Attacks
111
44
Dangerous attacks
32
Passes
503
Total passes
294
408
Accurate passes
194
16
Tackles
18
5
Corners
4
Discipline
2
Yellow cards
2
Championship Standings
| # | Team | PTS | MP | GD |
|---|---|---|---|---|
| 1 |  Leicester City Leicester City |
94 | 44 | 47 |
| 2 |  Leeds United Leeds United |
90 | 45 | 39 |
| 3 |  Ipswich Town Ipswich Town |
89 | 43 | 32 |
| 4 |  Southampton Southampton |
84 | 44 | 24 |
| 5 |  West Bromwich Albion West Bromwich Albion |
72 | 44 | 23 |
| 6 | Norwich City |
72 | 44 | 16 |
| 7 |  Hull City Hull City |
69 | 44 | 9 |
| 8 |  Coventry City Coventry City |
63 | 43 | 13 |
| 9 |  Middlesbrough Middlesbrough |
63 | 44 | 4 |
| 10 |  Preston North End Preston North End |
63 | 44 | -5 |
| 11 | Cardiff City |
62 | 44 | -11 |
| 12 |  Bristol City Bristol City |
59 | 44 | 4 |
| 13 |  Sunderland Sunderland |
56 | 44 | 1 |
| 14 | Swansea City |
56 | 44 | -5 |
| 15 |  Watford Watford |
53 | 44 | 1 |
| 16 |  Queens Park Rangers Queens Park Rangers |
53 | 45 | -12 |
| 17 | Millwall |
53 | 44 | -12 |
| 18 | Stoke City |
50 | 44 | -16 |
| 19 |  Blackburn Rovers Blackburn Rovers |
49 | 44 | -16 |
| 20 |  Plymouth Argyle Plymouth Argyle |
48 | 44 | -11 |
| 21 |  Sheffield Wednesday Sheffield Wednesday |
47 | 44 | -29 |
| 22 | Birmingham City |
46 | 44 | -16 |
| 23 | Huddersfield Town |
44 | 44 | -27 |
| 24 |  Rotherham United Rotherham United |
24 | 44 | -53 |
Promotion
Promotion Play-off
Relegation